FEATURES
What would be the CO2 emissions if a large amount of renewable energy generation
"CO2 Emissions of Electric Vehicles and Marginal Power Source Theory"
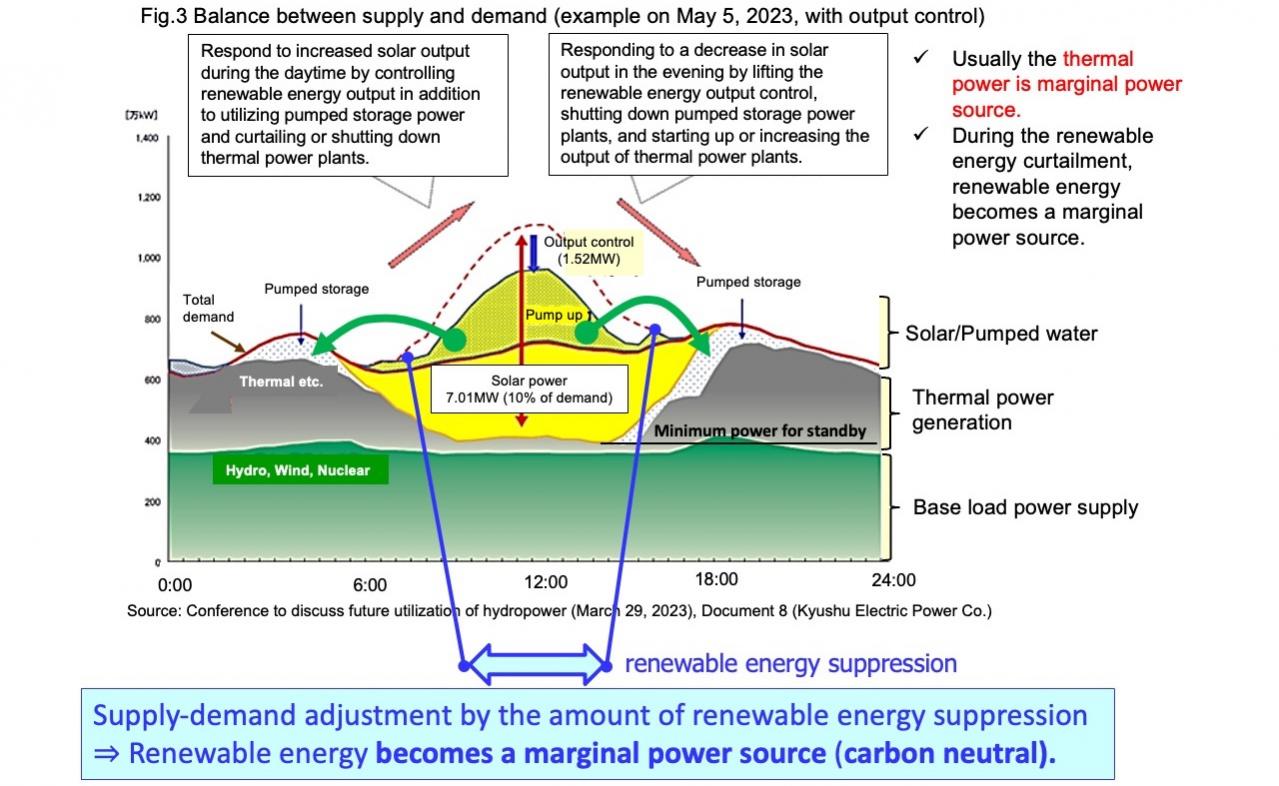
The horizontal axis shows time and the vertical axis shows power generation. From the bottom, it shows baseload power, thermal power, and solar power. Even if thermal power generation is reduced to the lowest output and solar power generation is absorbed by pumped storage, surplus power is still generated, so solar power generation is curbed during the daytime (indicated by the arrows) to adjust supply and demand. Since pumped storage power stored surplus power is suppressing thermal power generation, when that power is used to charge BEVs, thermal power compensates or the water level drops and pumped storage power generation during other hours decreases. Since the reduction is compensated by thermal power, the electricity will not be carbon neutral
Hiroaki Nagayama: Current Status and Future of Pumped Storage Power Plants, Kyoto University Graduate School of Renewable Energy Account No. 384, 2023
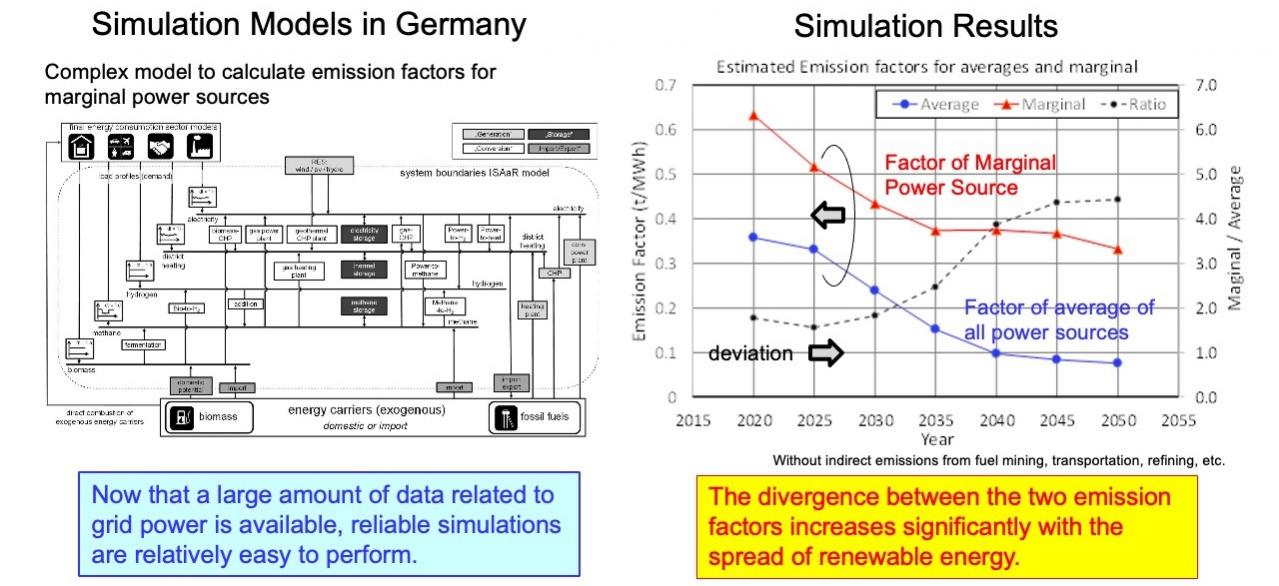
Using the calculation model on the left, they calculate the increase in CO2 emissions for a 1% increase in electricity demand throughout the year. Dividing it by the increase in electricity generation yields the average annual emission factor for marginal power sources. The figure on the right shows the horizontal axis from 2020 to 2050, and the vertical axis shows the average emission factors for all power sources and marginal power sources, as well as the deviation between them. The decrease from 2020 to 2035 for marginal power sources is due to the elimination of coal-fired power generation.
Felix Böing et al. : Hourly CO2 Emission Factors and Marginal Costs of Energy Carriers in Future Multi-Energy Systems, Energies 2019, 12, 2260; doi:10. 3390/en12122260
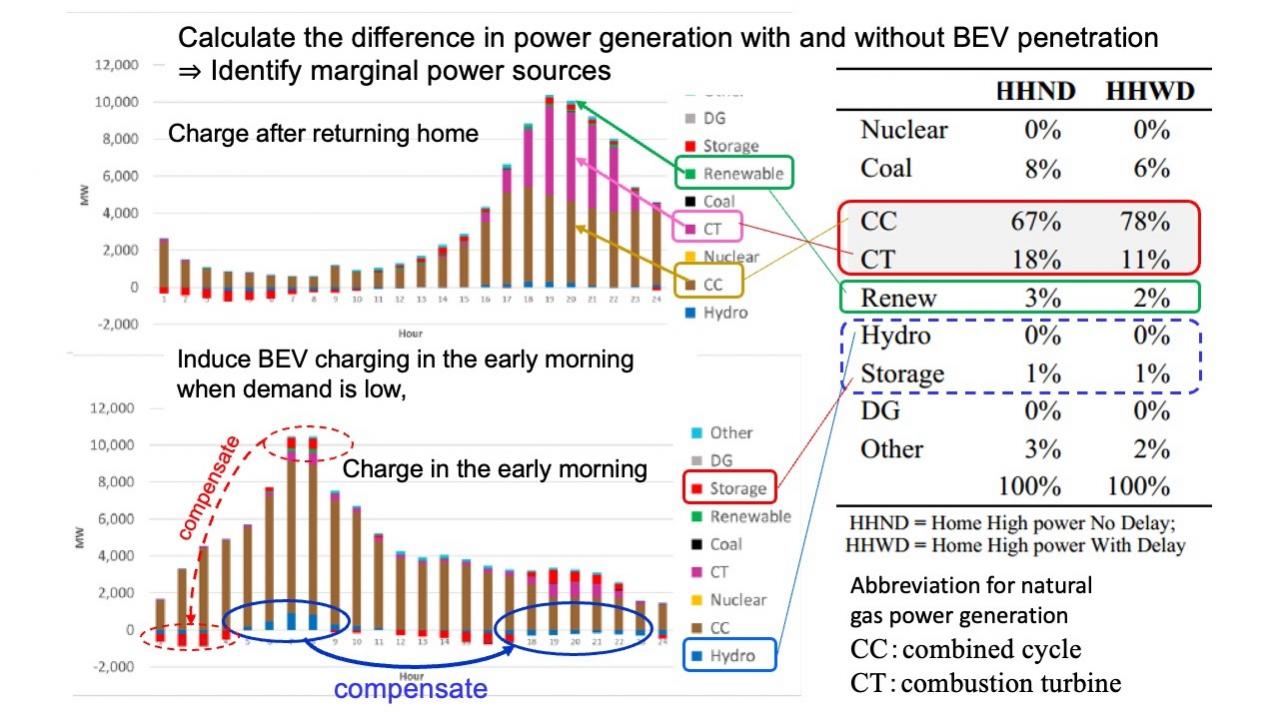
The horizontal axis shows the time of day and the vertical axis shows the amount of electricity generated. The top is the case of general charge, and the bottom is the case of inducing a charge in the early morning when demand is low. It is shown that most of the marginal power sources will be gas generation (CC, CT). It also shows that when hydropower and stored power are used, power generation during the rest of the day decreases and is compensated by thermal power generation. The table quantifies the contribution of each power source.
M. Kintner-Meyer et al . : Electric Vehicles at Scale - Phase I Analysis: High EV Adoption Impacts on the Western U.S. Power Grid, PNNL Report July 2020
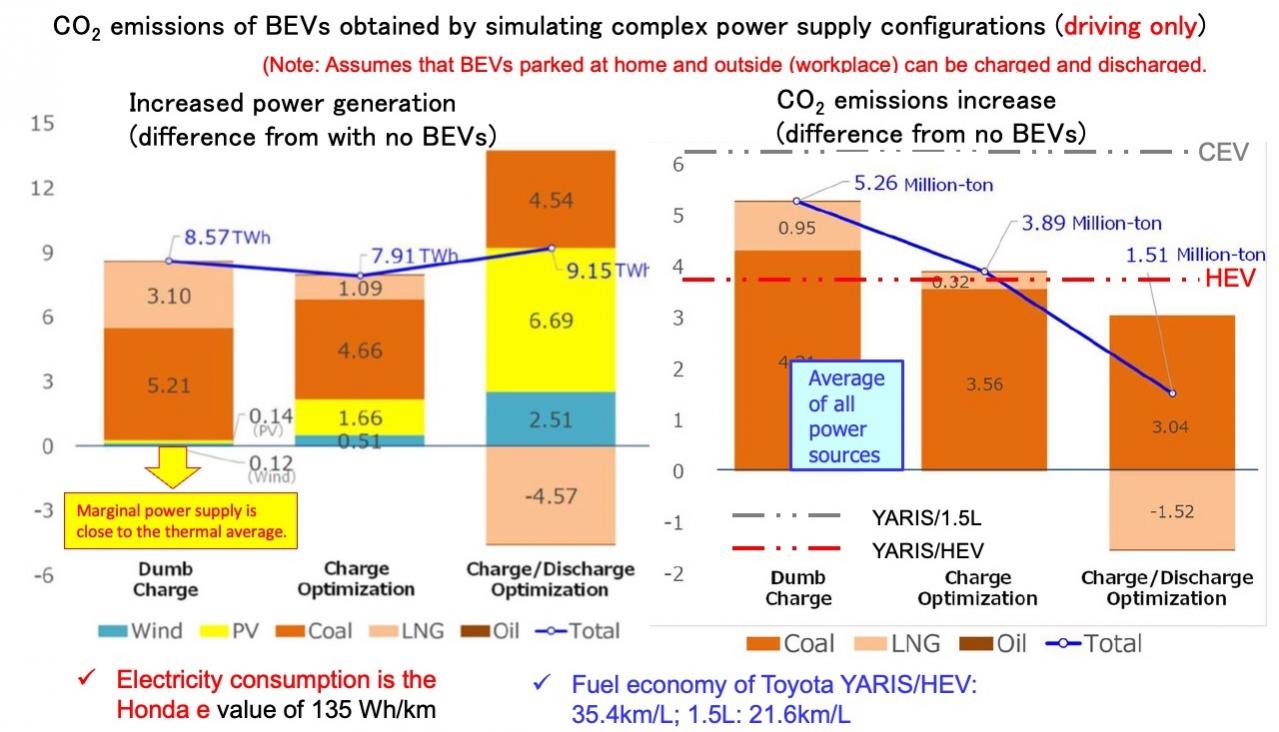
From left to right: charging immediately after returning home, implementing charge time optimization, and using V2G to optimize charging and discharging. Without charge time control, the marginal power supply consists mostly of thermal power generation. With the introduction of charge time control, yellow renewable energy increases; with V2G, even more renewable energy increases. For comparison, CO2 emissions of engine cars and HEVs are added in double dotted lines. Calculated values for the average of all power sources were also added for reference.
Atsuo Honda et al.:Impact of BEV Introduction in Japan on the Power Generation Mix and CO2 Emission through Demand-Side Optimization by BEV Charging and Discharging , SAE 2023-01-0065, (2023).
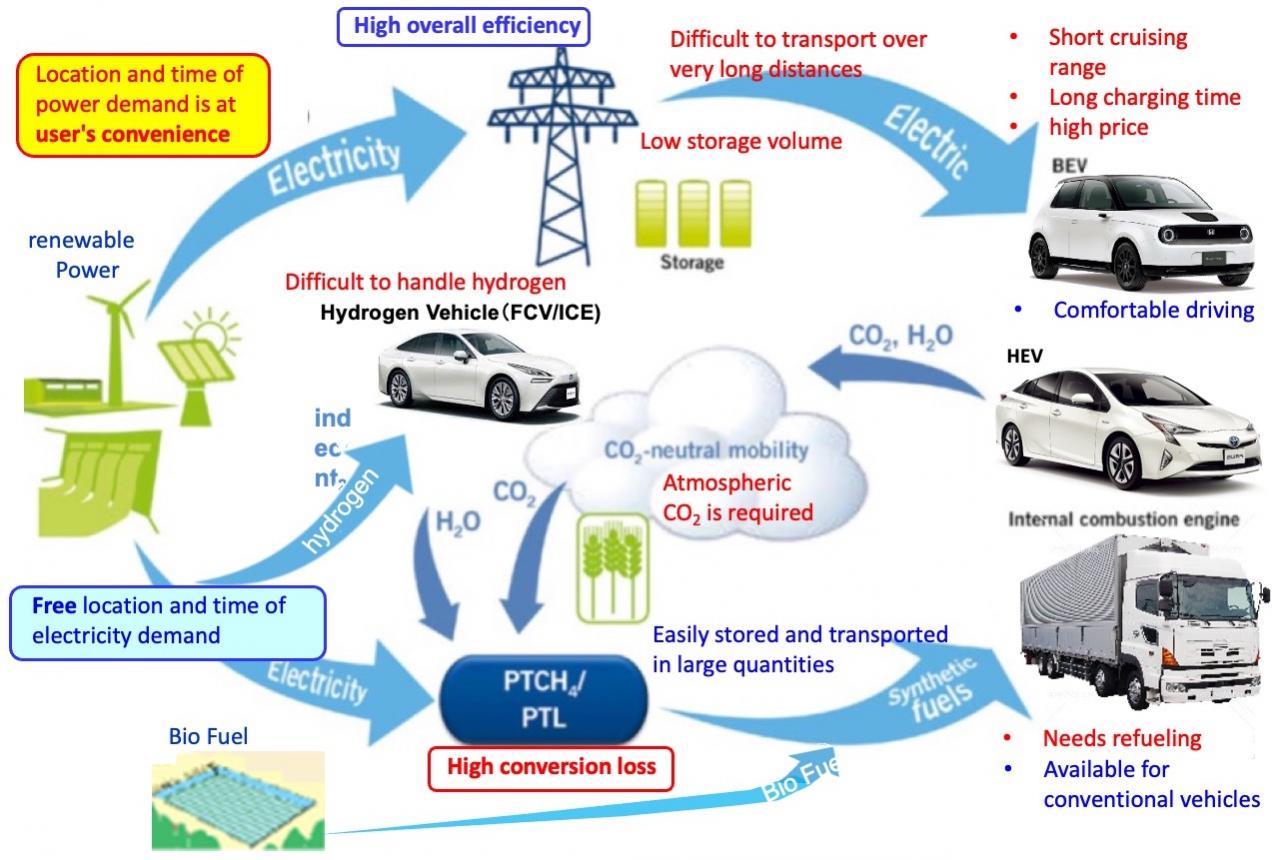
The flow of electricity from a renewable energy power plant to power a vehicle is shown. From the top, BEVs use renewable electricity directly, fuel cell vehicles (FCVs) and hydrogen engine vehicles use renewable electricity converted to hydrogen, and HEVs and engine vehicles use hydrogen converted to hydrocarbons. Hydrogen production for FCVs and engines has lower overall efficiency, but allows the user to set where and when electricity is used.
Richard Backhaus : Alternative Fuels CO2-neutral into the Future, MTZ2017/06
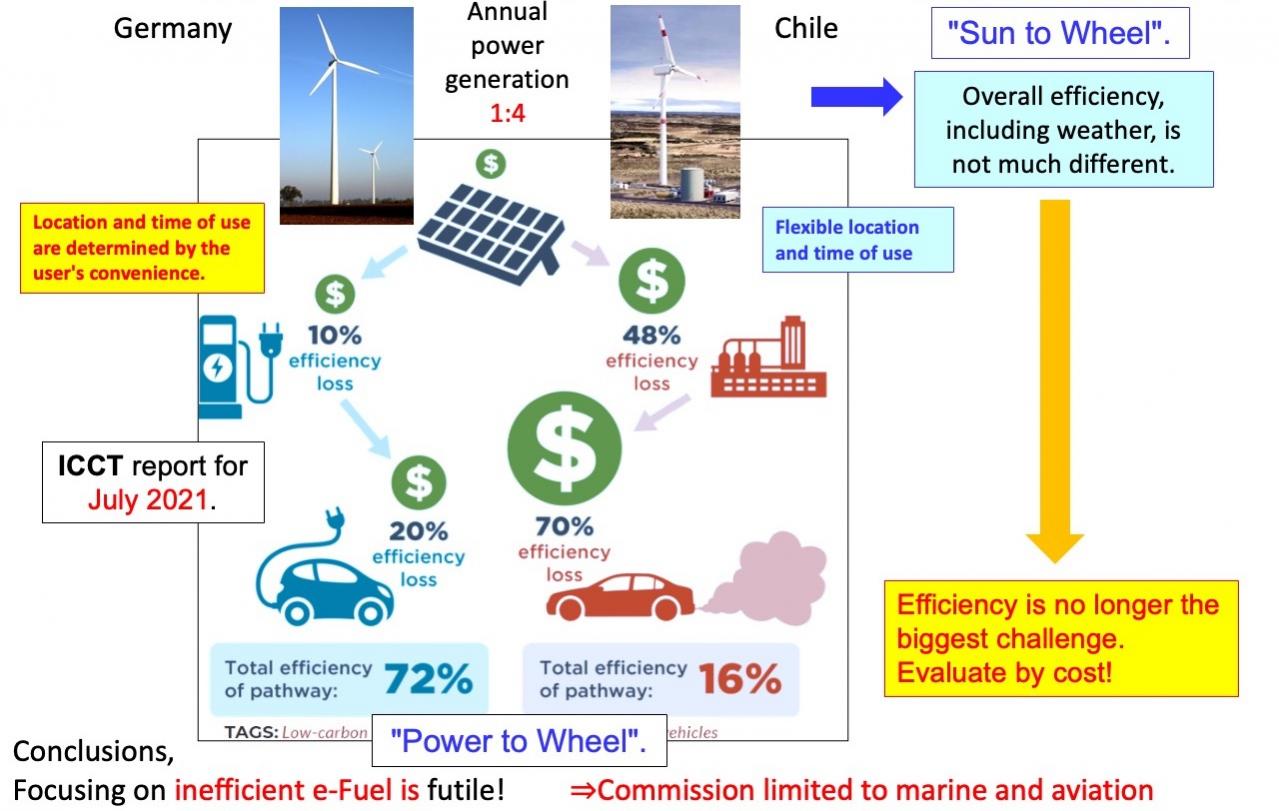
The "Power to Wheel" efficiency from the solar power plant to the car is calculated to show that the efficiency of e-Fuel is significantly lower than that of BEVs. As the author added outside the box, a wind turbine installed in Chile generates four times as much electricity as one installed in Germany (four times more efficient), so there is no significant difference in the overall "Sun to Wheel" efficiency, including weather.
Stephanie Searle ; e-fuels won't save the internal combustion engine, ICCT , JUNE 23, 2020
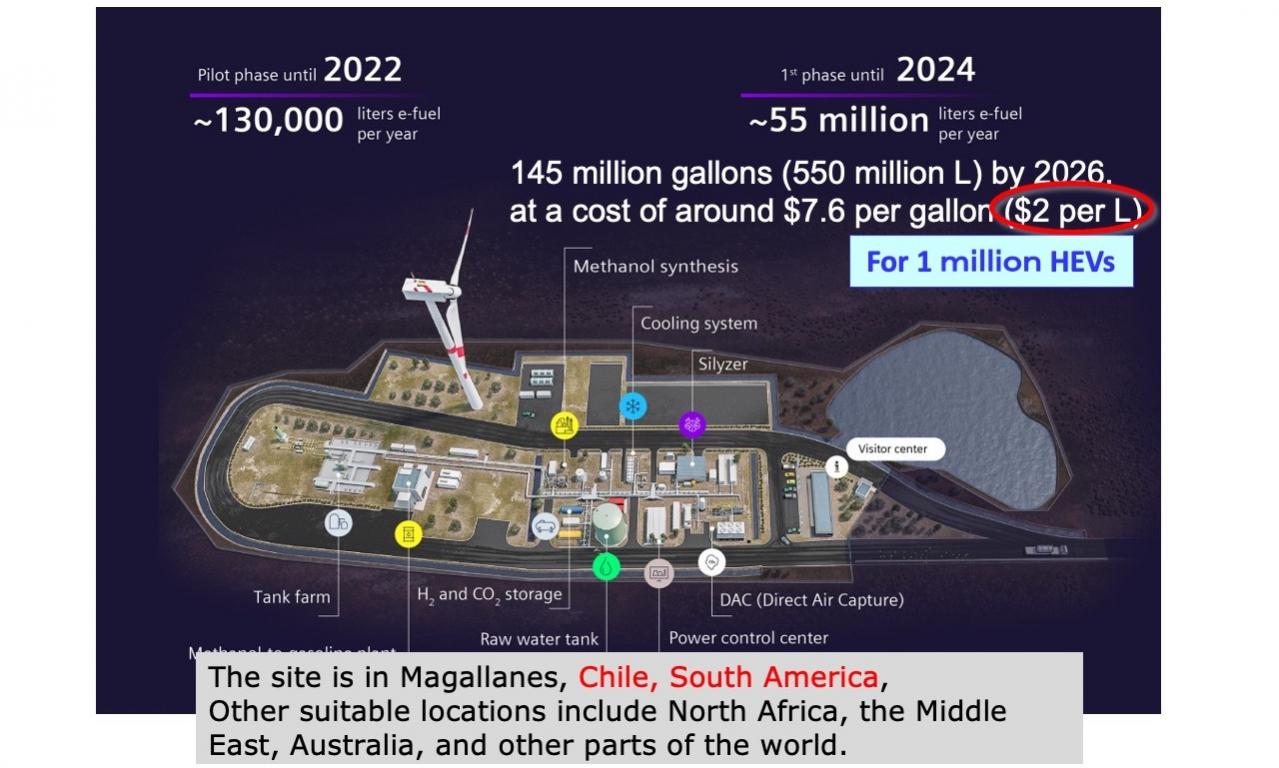
The site is in Magallanes, Chile, South America, with plans to begin production in 2022 and produce 550 million liters/year of e-Fuel (gasoline) in 2026, at a projected price of about $2/L. The production volume is equivalent to 1.1 million HEVs running carbon-neutral. In addition to Chile, there are other suitable sites around the world, including North Africa, the Middle East, and Australia
Jonathan M. Gitlin : Porsche and Siemens Energy break ground on low-carbon e-fuel plant in Chile_ 9/11/2021


