What would be the CO2 emissions if a large amount of renewable energy generation
"CO2 Emissions of Electric Vehicles and Marginal Power Source Theory"
Electric vehicles (BEVs) do not emit emissions, so policies to promote BEVs to reduce CO2 emissions are spreading around the world, the reality is that power plants emit CO2 when charging BEVs. CO2 emissions from power plants vary greatly depending on the type of power generation, so it is critically important which power plant's electricity is used. However, since it is not known which power plants are used for charging, a wrong calculation method has conventionally been used, which assumes that electricity from all power plants is used on average. However, using the concept of marginal power sources, it is possible to identify the power plants and calculate emissions that are close to actual emissions.
TEXT & FIGURE: Dr. HATAMURA Koichi
目次
Marginal power source in case of large penetration of renewable energy generation
Regarding the calculation of CO2 emissions in the case of mass diffusion of renewable energy generation, we will consider the use of electric energy generated by solar and wind power, which is expected to become the mainstream in the future.
It is easy to assume that the increase in renewable power generation will make carbon-neutral power available, however, the reality is not so simple. Since renewable energy generation connected to the power grid usually suppresses thermal power generation, the use of such power increases the amount of thermal power generation. Here we consider the conditions under which renewable energy can be used as carbon-neutral electricity.
Figure 10 shows an example of Kyushu as an example of the power supply configuration when renewable energy generation increased. On this day, electricity demand was low because it was a holiday and solar power generation was active during the day, resulting in a surplus of electricity. Therefore, the supply-demand balance was adjusted by suppressing renewable energy generation. During the time when renewable energy generation is suppressed, electricity use becomes carbon neutral because renewable energy becomes a marginal power source. In other words, the amount of renewable energy generation increases as electricity used. Outside of this time period, thermal power generation increases when electricity demand increases, so it does not become carbon neutral, and measures to induce BEV charging during this time period prove to be effective.
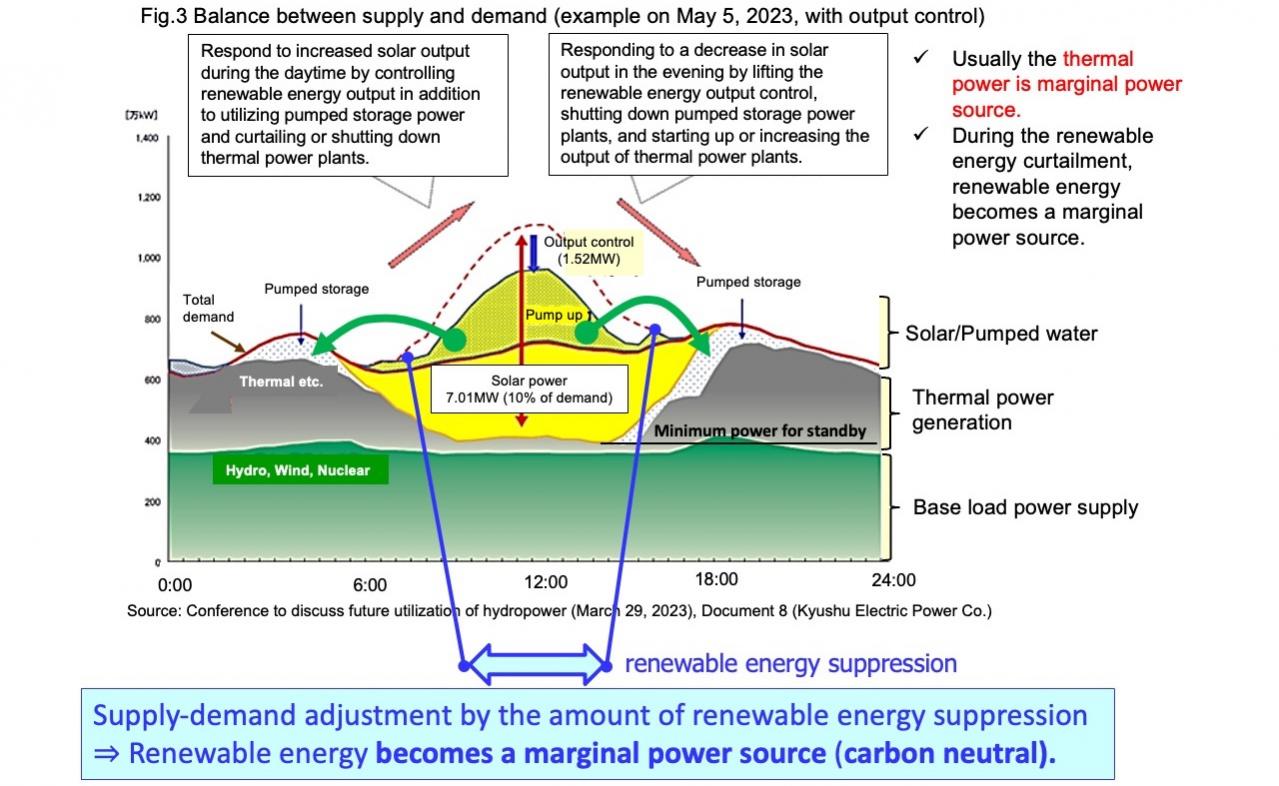
The horizontal axis shows time and the vertical axis shows power generation. From the bottom, it shows baseload power, thermal power, and solar power. Even if thermal power generation is reduced to the lowest output and solar power generation is absorbed by pumped storage, surplus power is still generated, so solar power generation is curbed during the daytime (indicated by the arrows) to adjust supply and demand. Since pumped storage power stored surplus power is suppressing thermal power generation, when that power is used to charge BEVs, thermal power compensates or the water level drops and pumped storage power generation during other hours decreases. Since the reduction is compensated by thermal power, the electricity will not be carbon neutral
Hiroaki Nagayama: Current Status and Future of Pumped Storage Power Plants, Kyoto University Graduate School of Renewable Energy Account No. 384, 2023
Using a simulation of the power supply configuration to identify marginal power sources can be used to calculate CO2 emissions from electricity use, but the simulation will become more complex and difficult. Because not only do the emission factors vary greatly from power source to power source, but also as renewable energy generation increases and the opportunity for renewable energy to become a marginal power source increases, as well as the amount of energy storage increases and its control is added.
Using a complex simulation model, the projected emission factors for marginal power sources in Germany through 2050 are shown in Figure 11. While the average emission factor of all power sources decreases significantly as renewable energy generation increases, the decrease in the emission factor of marginal power sources is small, indicating that the divergence increases significantly with the spread of renewable energy. It also shows the large effect of the abolition of coal-fired power generation.
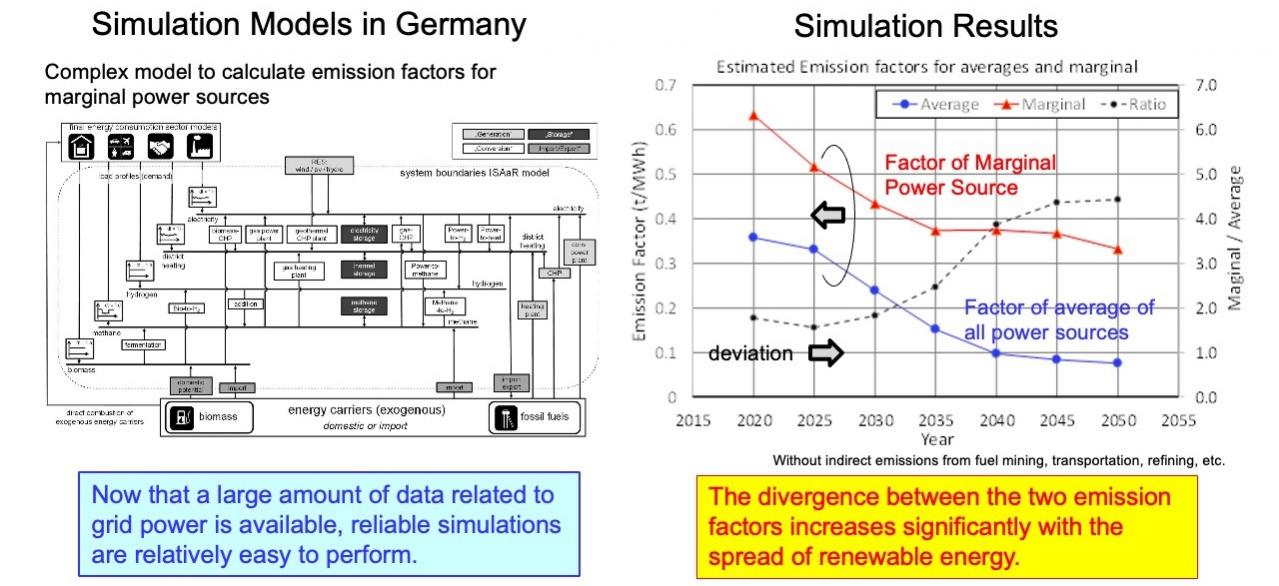
Using the calculation model on the left, they calculate the increase in CO2 emissions for a 1% increase in electricity demand throughout the year. Dividing it by the increase in electricity generation yields the average annual emission factor for marginal power sources. The figure on the right shows the horizontal axis from 2020 to 2050, and the vertical axis shows the average emission factors for all power sources and marginal power sources, as well as the deviation between them. The decrease from 2020 to 2035 for marginal power sources is due to the elimination of coal-fired power generation.
Felix Böing et al. : Hourly CO2 Emission Factors and Marginal Costs of Energy Carriers in Future Multi-Energy Systems, Energies 2019, 12, 2260; doi:10. 3390/en12122260
This paper was published in 2019, so it does not reflect recent policy changes. If all thermal power generation becomes carbon neutral in the future, the marginal power source theory will no longer come into play as the two emission factors will both approach zero, which is what we should aim for.
Characteristics of Marginal Power Supply from Simulation
Two examples of specific CO2 emissions calculations using such simulations are given; while many papers have been written to confirm or deny the spread of BEVs, these two papers are credible because they have different objectives.
The first is a report from PNNL that uses complex simulations to determine the impact on the power system if BEVs become widespread. Assuming a California in 2028 with more than 50% renewable energy, the report calculates the difference in generation mix between the case of mass deployment of BEVs and the case of no deployment. In other words, it identifies marginal power sources.
Figure 12 shows the average summer day when solar is active and surplus power is generated. The contribution of each source to the marginal power supply shows that gas power generation accounts for most of the marginal power, and that there are very few opportunities for renewable energy to become a marginal source. It also shows that hydropower and storage (pumped storage) rarely become marginal power sources.
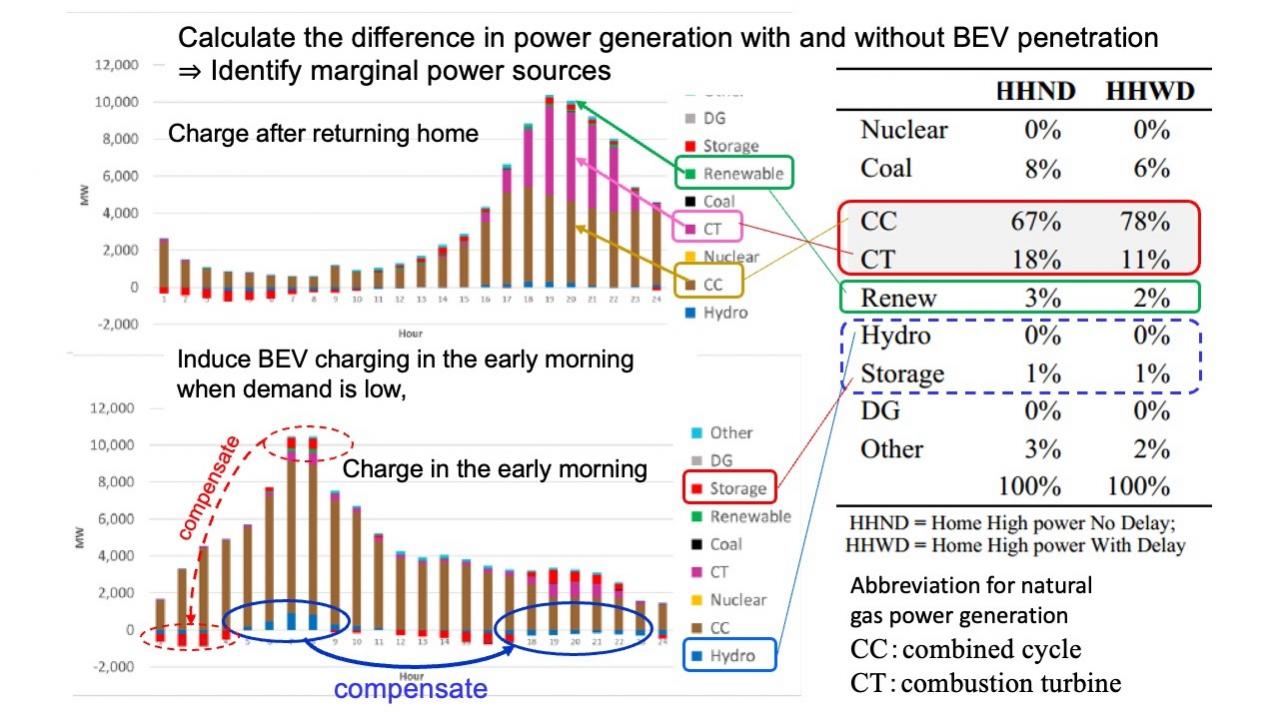
The horizontal axis shows the time of day and the vertical axis shows the amount of electricity generated. The top is the case of general charge, and the bottom is the case of inducing a charge in the early morning when demand is low. It is shown that most of the marginal power sources will be gas generation (CC, CT). It also shows that when hydropower and stored power are used, power generation during the rest of the day decreases and is compensated by thermal power generation. The table quantifies the contribution of each power source.
M. Kintner-Meyer et al . : Electric Vehicles at Scale - Phase I Analysis: High EV Adoption Impacts on the Western U.S. Power Grid, PNNL Report July 2020
this example, the power network in the western United States is considered, but in Europe, where the power network extends across countries, there is a difficulty in correctly identifying marginal power sources unless the power system network, including neighboring countries, is also considered. For example, a Swedish researcher studying marginal power sources points out that even in Sweden, where renewable energy and nuclear power make up 90% of the power supply, most of the marginal power sources will be Polish coal-fired power. The use of electricity in Sweden would reduce exports to Poland, and Poland would increase its coal-fired power.
Second, we present a paper by Mr. Honda of Osaka Gas that uses simulations of complex power supply configurations to determine the increase in power generation and CO2 emissions in 2030 resulting from the introduction of 10 million BEVs in Japan. The research applies simulation technology developed at the Ogimoto Laboratory of the University of Tokyo.
The left side of Figure 13 shows the increase in power generation associated with the spread of BEVs, and the right side shows the increase in CO2 emissions in each case. Although not shown in the figure, when CO2 emissions from battery manufacturing are taken into account, the CO2 emissions from LCA of BEVs are not much different from those of engine vehicles. Furthermore, the effects of charge time control and V2G are shown to be significant, but since the assumption is that all BEVs parked in homes and offices can be charged and discharged, a policy to install charging facilities and induce charging time is essential
Calculations using the average emission factor for all power sources will result in CO2 emissions less than half those of marginal power sources. As a result, the CO2 emissions of BEVs are evaluated as being overwhelmingly low, leading to erroneous policy decisions that HEVs are not needed and that there is no need to rush into charge time control and V2G. Additionally, there is the problem of underestimating the effects of charge time control and V2G.
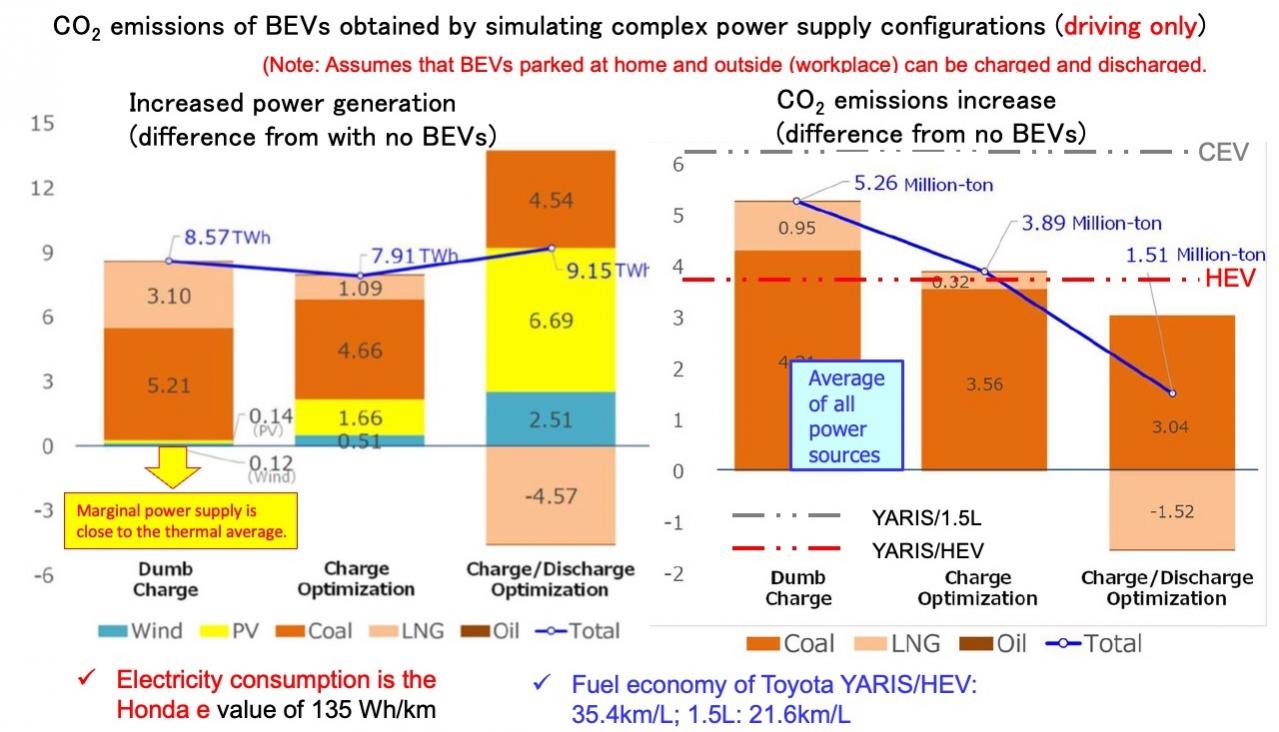
From left to right: charging immediately after returning home, implementing charge time optimization, and using V2G to optimize charging and discharging. Without charge time control, the marginal power supply consists mostly of thermal power generation. With the introduction of charge time control, yellow renewable energy increases; with V2G, even more renewable energy increases. For comparison, CO2 emissions of engine cars and HEVs are added in double dotted lines. Calculated values for the average of all power sources were also added for reference.
Atsuo Honda et al.:Impact of BEV Introduction in Japan on the Power Generation Mix and CO2 Emission through Demand-Side Optimization by BEV Charging and Discharging , SAE 2023-01-0065, (2023).
In order to achieve carbon neutral driving
In order for a car to run carbon-neutral, the primary energy source for running both BEVs and HEVs must be renewable energy. Since thermal power generation increases when electricity demand increases outside of the renewable energy curtailment period, BEVs can only run carbon-neutral if they are recharged during the curtailment period. Hydrogen production and battery-switchable BEVs have the great advantage of being able to selectively use power during these hours. We will consider how to achieve carbon-neutral driving by using such renewable energy power.
The energy flow of various eco-friendly vehicles and their generally accepted advantages and disadvantages are described in Figure 14, but what is important here is the overall efficiency and the location and time of electricity demand. Even when renewable energy accounts for a large portion of electricity generation, electricity used in remote areas or during times when renewable energy generation is curtailed is carbon neutral, but the rest is not. Therefore, opportunities for BEVs to use carbon neutral power are limited. Hydrogen use differs from BEVs in that the location and time of electricity use can be set freely. This is where the potential of e-Fuel made from hydrogen lies.
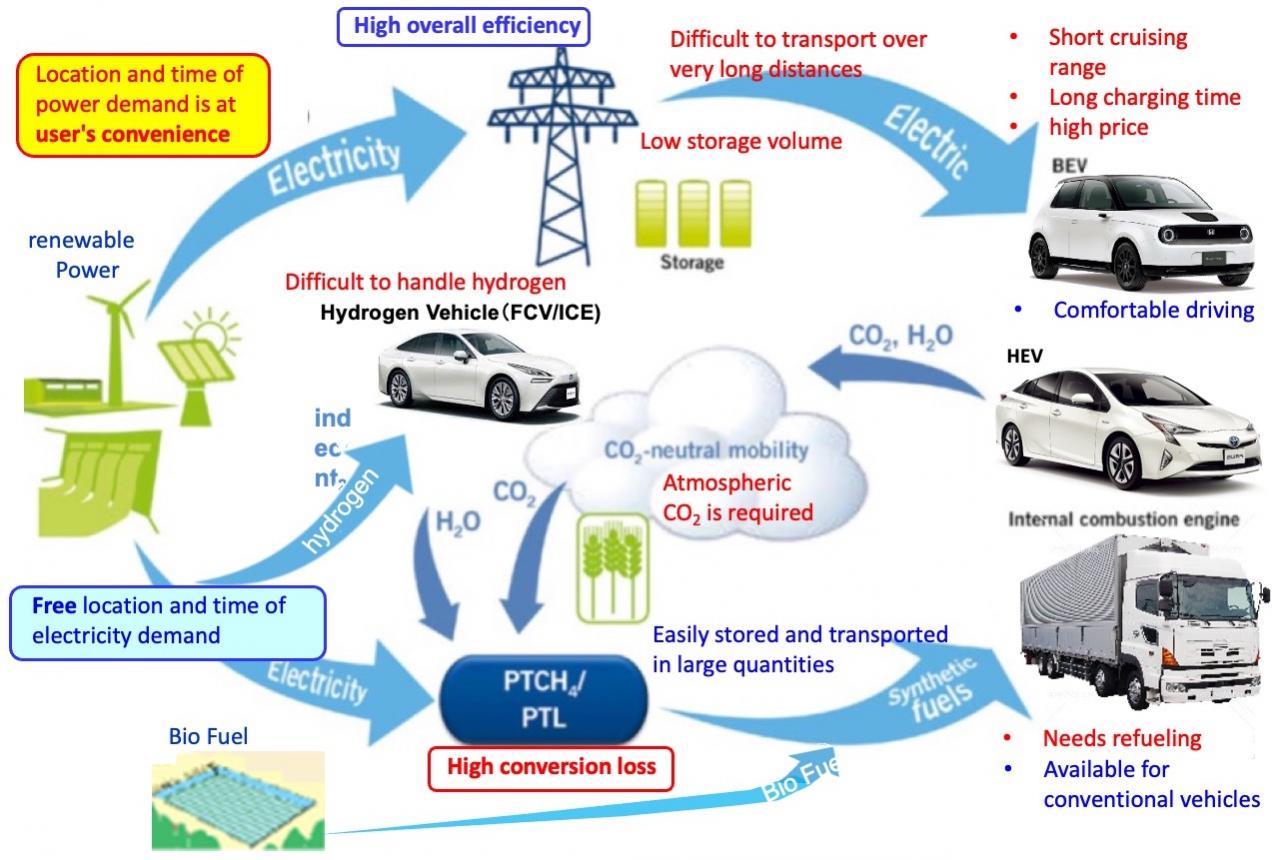
The flow of electricity from a renewable energy power plant to power a vehicle is shown. From the top, BEVs use renewable electricity directly, fuel cell vehicles (FCVs) and hydrogen engine vehicles use renewable electricity converted to hydrogen, and HEVs and engine vehicles use hydrogen converted to hydrocarbons. Hydrogen production for FCVs and engines has lower overall efficiency, but allows the user to set where and when electricity is used.
Richard Backhaus : Alternative Fuels CO2-neutral into the Future, MTZ2017/06
The problem with e-Fuel (hydrogen) is that it is not energy efficient. For example, the International Council on Clean Transportation (ICCT) has issued a report against e-Fuel in conjunction with the release of "Fit for 55”.
As shown in Figure 15, he quantitatively compares the overall efficiency of BEVs and e-Fuel engine vehicles, and goes so far as to say, "Focusing on the inefficient e-Fuel is a waste!” ICCT is evaluated on a "Power to Wheel" basis, from the power plant to the wheel. Remember that the location and time of recharging for BEVs are determined by the user, while the location and time of producing hydrogen for e-fuel can be set freely. It is estimated that a wind turbine installed in Chile generates four times as much electricity as one installed in Germany, so the overall "Sun to Wheel" efficiency, including weather, is actually not much different. In addition, efficiency is not an issue when using surplus power that would otherwise be disposed of. In the end, the evaluation should be based on cost, not efficiency.
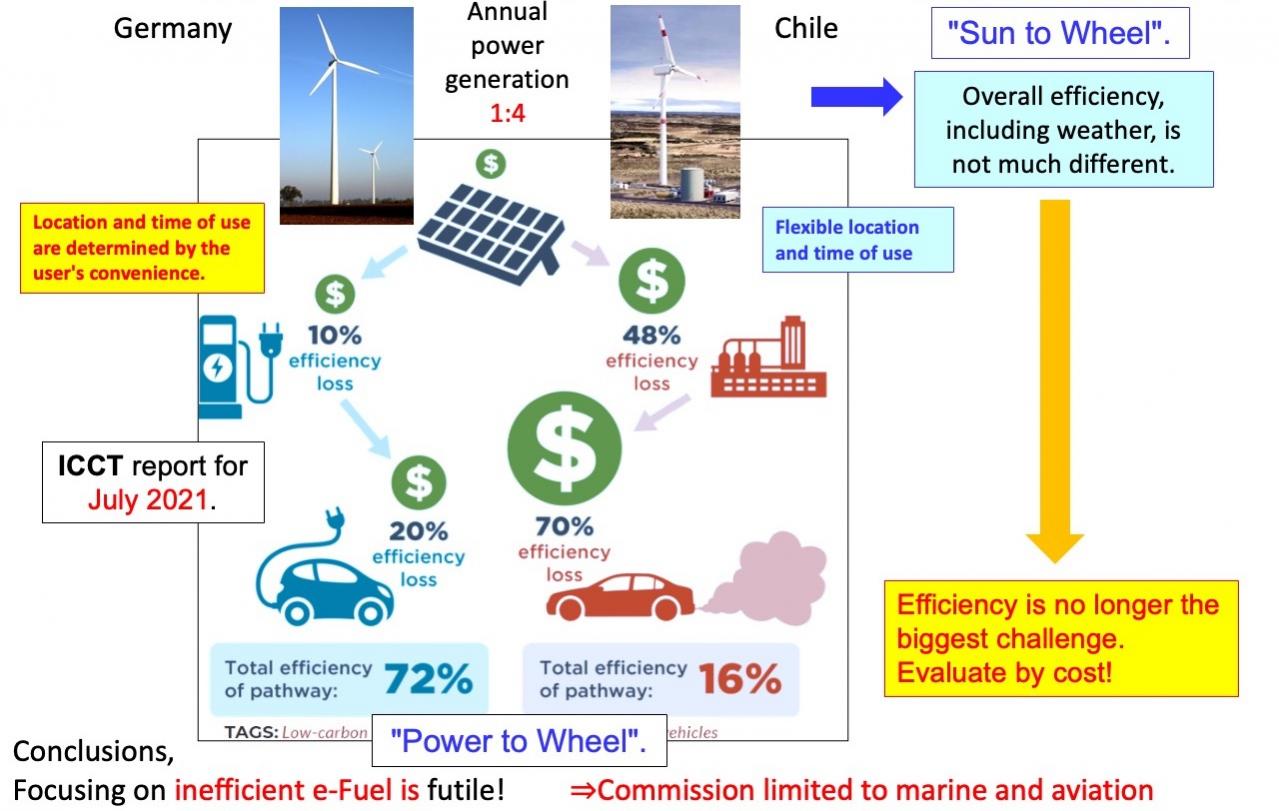
The "Power to Wheel" efficiency from the solar power plant to the car is calculated to show that the efficiency of e-Fuel is significantly lower than that of BEVs. As the author added outside the box, a wind turbine installed in Chile generates four times as much electricity as one installed in Germany (four times more efficient), so there is no significant difference in the overall "Sun to Wheel" efficiency, including weather.
Stephanie Searle ; e-fuels won't save the internal combustion engine, ICCT , JUNE 23, 2020
A commercial e-Fuel (gasoline) plant being promoted by Porsche and Siemens is shown in Figure 16. Since a renewable energy power plant far from the consumption area, like this plant, cannot send power to the consumption area, its use of electricity is carbon neutral. However, since there is no plant that emits CO2 , CO2 transport or DAC (atmospheric CO2 collection) is required. The price is projected to be around $2/L.
There are many areas around the world far from consumption areas that are suitable for renewable energy generation. It is important to note that several similar projects are underway around the world.
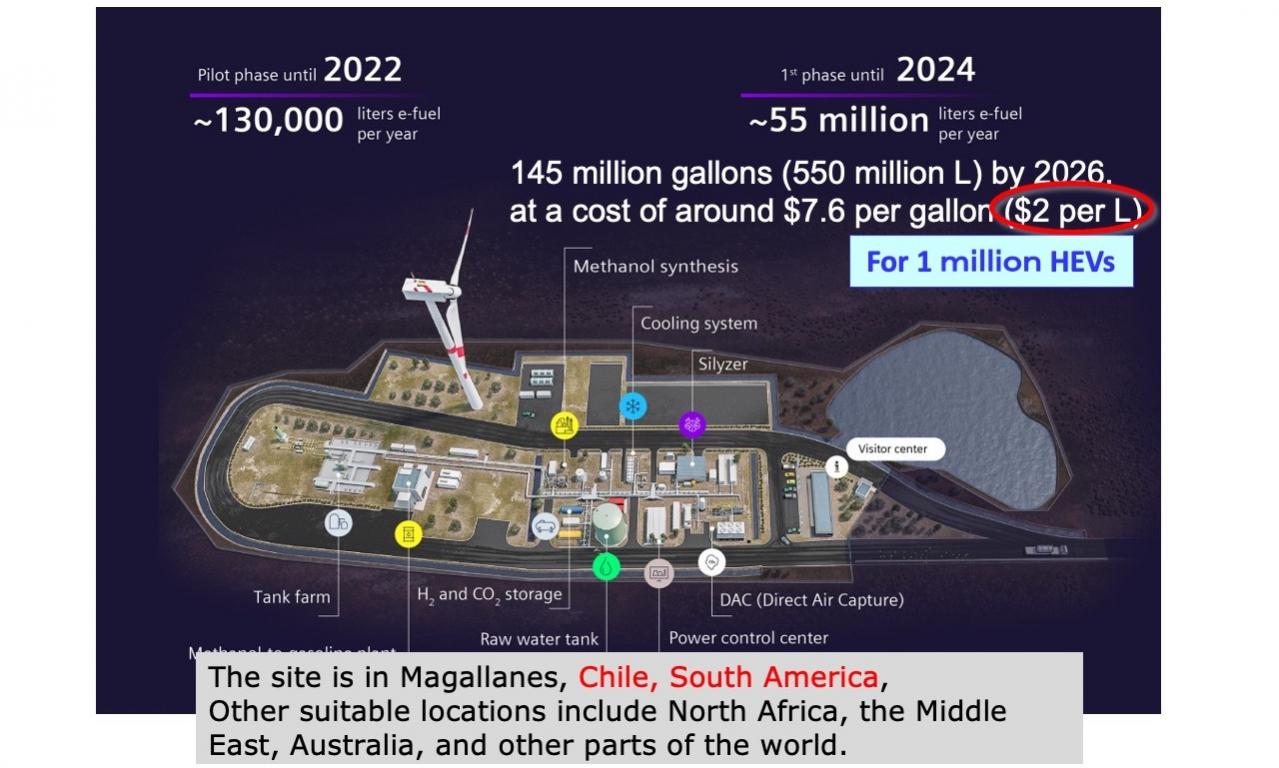
The site is in Magallanes, Chile, South America, with plans to begin production in 2022 and produce 550 million liters/year of e-Fuel (gasoline) in 2026, at a projected price of about $2/L. The production volume is equivalent to 1.1 million HEVs running carbon-neutral. In addition to Chile, there are other suitable sites around the world, including North Africa, the Middle East, and Australia
Jonathan M. Gitlin : Porsche and Siemens Energy break ground on low-carbon e-fuel plant in Chile_ 9/11/2021
Power Supply Policy and Long-term Marginal Power Sources
While I have considered short-term marginal power sources up to this point, I will briefly introduce the concept of long-term marginal power sources, including new construction and disposal of power supply facilities.
It is common practice to use the average emission factor for all power sources even in the medium to long term, and the reason for this is explained in the Ministry of the Environment's "Procedures and Considerations for Calculating CO2 Reduction Effects" as follows.
This emission factor is also called the marginal emission factor and may be more appropriately evaluated. However, in the medium to long term, there is a possibility that supply adjustments will be made for power sources other than thermal power, and it is difficult to predict such adjustments at this time; therefore, in principle, emission factors for all power sources are used.
Long-term marginal power sources differ from short-term power sources in that they take into account the construction and disposal of new generation facilities as electricity demand changes, but in some respects long-term forecasting is difficult because the construction and disposal of facilities varies greatly depending on policies. However, under the current power supply policy, it is unlikely that the increase or decrease in BEV charging demand will result in an increase or decrease in renewable energy and nuclear power generation facilities, so in most cases the long-term marginal power source will be coal- or natural gas-fired power generation. The choice of coal or natural gas is largely determined by power supply policies (e.g., carbon tax), which is difficult to predict.
Next, consider the case where the marginal power source is determined by policy. For example, (1) If a cap is placed on the total amount of coal-fired power generation in order to curb coal-fired power generation, natural gas-fired power generation will become the marginal power source because the amount of coal-fired power generation will not change even if demand changes. (2) If subsidies for BEVs are eliminated to curb their spread and the budget is used to subsidize the elimination of coal-fired power generation, coal-fired power generation becomes the marginal power source.
Thus, since the long-term marginal power sources are also likely to be thermal power generation, using the average emission factor of all power sources, even in the long term, will result in a value that is far from the actual one. The emission factors for marginal power sources calculated by simulation should be used after forecasting future changes in the power source composition.
summary
The conventional calculation of CO2 emissions using the average emission factor for all power sources is incorrect. I would like to point out that using incorrect formulas will underestimate the effect of energy conservation (electricity saving) as well as BEVs. As a result, energy conservation efforts will not progress, there is a risk of electrification that will increase CO2 emissions, and there will be little progress in devising ways to use electricity that reduce CO2 emissions (such as inducing BEV charging times),,,,,,,,,,,and various problems. Another important issue is to hasten the transition of all thermal power generation to carbon neutrality.
Only when the fact that “The conventional calculation of CO2 emissions is wrong." is widely recognized, will effective CO2 emission reduction measures be considered.


