Is the calculation of CO2 emissions from electric vehicles correct?
CO2 Emissions of Electric Vehicles and Marginal Power Source Theory
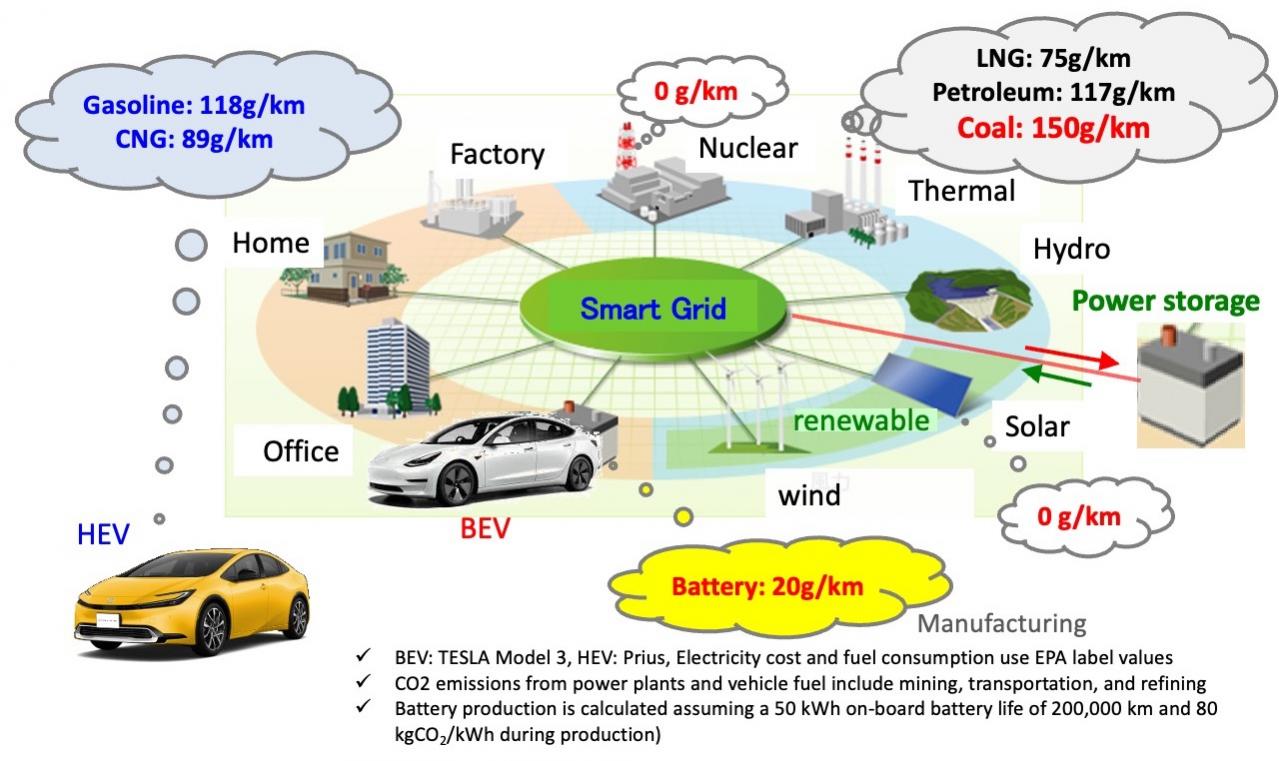
Electric vehicles (BEVs) do not emit emissions, so policies to promote BEVs to reduce CO2 emissions are spreading around the world, the reality is that power plants emit CO2 when charging BEVs. CO2 emissions from power plants vary greatly depending on the type of power generation, so it is critically important which power plant's electricity is used. However, since it is not known which power plants are used for charging, a wrong calculation method has conventionally been used, which assumes that electricity from all power plants is used on average. However, using the concept of marginal power sources, it is possible to identify the power plants and calculate emissions that are close to actual emissions.
TEXT & FIGURE: Dr. HATAMURA Koichi
目次
Preface
This is the seventh installment of this annual report, which I started in 2018. A quick reread shows that all along I have been writing about the fact that the calculation of CO2 emissions of electric vehicles (BEVs) does not match the reality and the potential of e-Fuel. Last year, in Europe, which was pushing for a ban on the sale of engine cars (including HEVs) in 2035, the industry filed an objection and settled on not banning the sale of engine cars that use e-Fuel. However, the specifics of the regulation have not yet been decided.
In Europe, the auto industry is beginning to argue that a variety of technologies, such as e-Fuel, are needed to reduce CO2 emissions from automobiles, rather than just focusing on BEVs. One of the arguments for this is that "the calculation of CO2 emissions from BEVs is wrong.", and " IASTEC (a group of European energy and engine researchers) wrote in a letter to the EU Parliament. Some engine researchers in the U.S. have also begun to raise their voices, and this issue was addressed in a lecture at an international conference called PE&L2024 held in Kyoto in September last year . These means that this issue, which I have been advocating for a long time, is beginning to be recognized as a problem in the world.
This calculation, which is related to the operation of the power system, is very complicated and difficult to understand, and the author has long wondered if an easy-to-understand explanation could be provided, but with reference to reports from Europe and the United States, a logical explanation can now be summarized in the Marginal Power Sourece Theory . Therefore, in this year's New Year's Message, I will focus on this issue of calculation of CO2 emissions.
Methodology for calculating the two CO2 emissions for the average of all sources and for marginal sources
In the IASTEC letter, the calculation of CO2 emissions using the average emission factor for all power sources is explained in an easy-to-understand manner as shown in Figure 1, comparing it to the cost burden of his daughter Eve's student life. In a paper published at the same time, they also presented the results of a calculation showing that the actual CO2 emissions of BEVs are about twice the amount of the conventional calculation (average of all power sources).
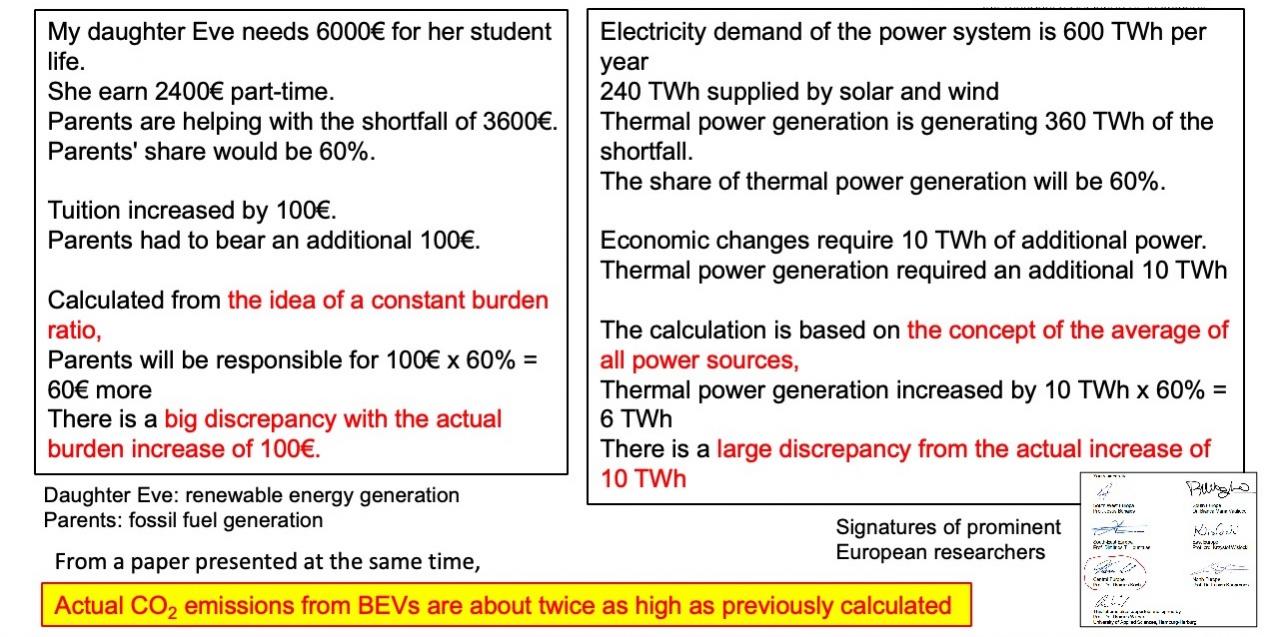
Daughter Eve is compared to renewable energy generation and her parents to fossil fuel generation. If additional expenditures are calculated assuming that the parents' share of the burden remains the same, they do not match the actual additional expenditures. Similarly, the concept of an average for all power sources, which assumes that the emission factor remains the same, results in a large discrepancy between the calculated value and reality. The marginal power source approach is to calculate the actual additional expenditure/increase.
IASTEC : Open Letter to the EU-Council and Representatives of EU-states, 2022, https://iastec.org/open-letter-2
Applying what the IASTEC letter claims to the case of comparing CO2 emissions of BEVs and HEVs for a 100 km trip, Figure 2 shows that the emission factors of the average of all sources and marginal sources are currently used to calculate CO2 emissions for BEVs, but the way the emission factors are taken reverses the result. This is a major problem. We will examine in detail why there are two formulas and whether the calculation of the average of all sources is wrong as IASTEC says.
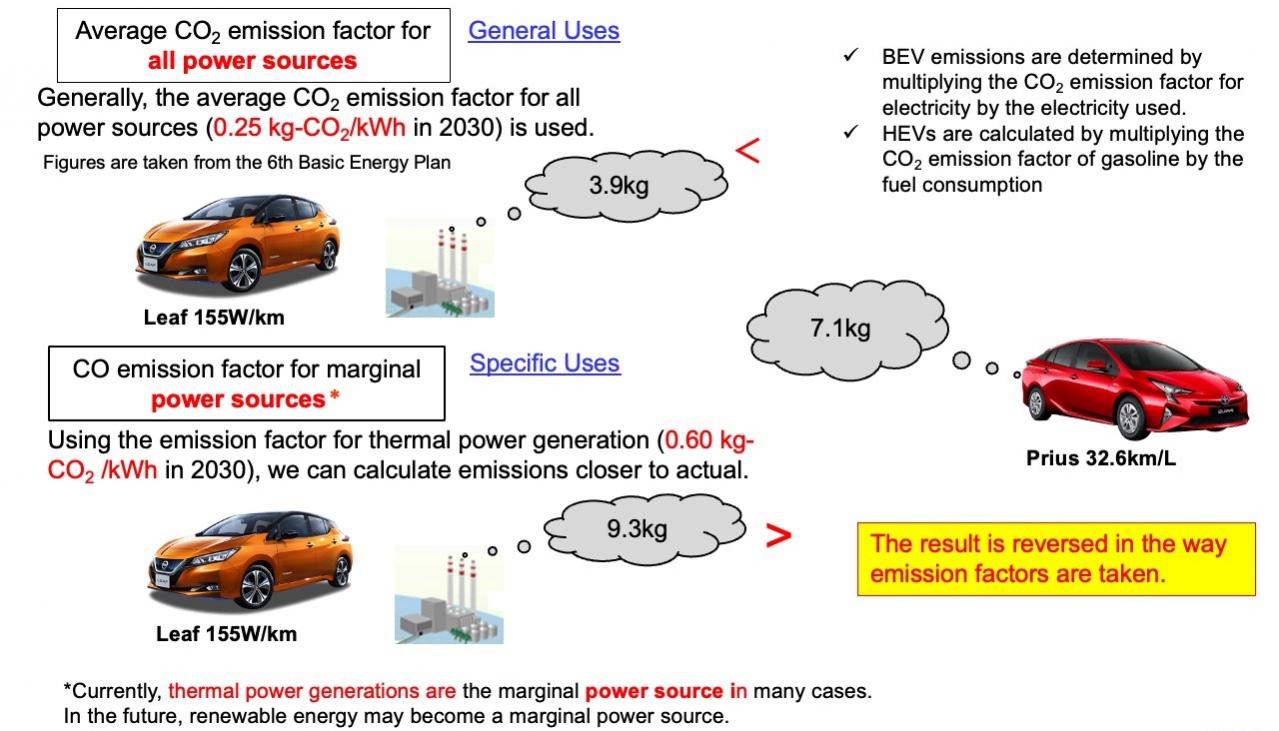
Generally, the average emission factor for all power sources is used, and the CO2 emissions of a BEV (Nissan LEAF) are calculated to be 3.9 kg for a 100 km trip. In some specialized cases, the emission factor for marginal power sources is used, which is 9.3 kg, more than double the value. On the other hand, the HEV (Prius) is calculated to be 7.1 kg based on fuel consumption.
Since electricity does not have a color, it is impossible to know which power plant the charger you are using is using electricity from. Therefore, it is common to use the average emission factor of all power sources without even thinking about it. However, considering the operational control of power plants, it is possible to identify the power sources that increase their electricity production when the chargers are used. This is the marginal power source, and using the emission factor of the marginal power source instead of the average of all power sources will provide a value close to the actual one. This is IASTEC's recommendation, but it is not commonly used.
Now let us consider how to properly calculate the CO2 emissions of BEVs. Figure 3 shows the annual power generation and CO2 emissions for all power plants. When BEV charging demand is added to this figure, CO2 emissions increase as the amount of electricity generated by the power system increases. This increase is the CO2 emissions from BEV recharging; note that the addition of BEV power demand changes the power supply mix as marginal power sources increase their generation.
Power sources that change their generation as a result of normal power system operation are referred to as short-term marginal power sources, while power sources that change as a result of new construction or disposal of power plant facilities are referred to as long-term marginal power sources. For the sake of simplicity, we will discuss short-term marginal power sources here.
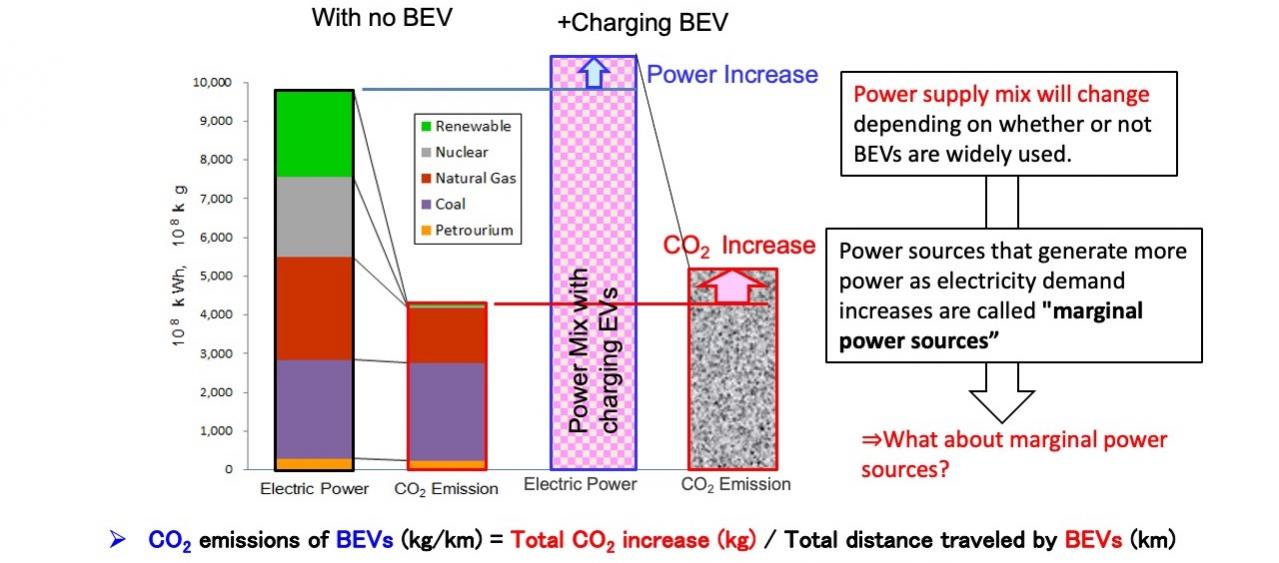
The bar graph on the left shows annual electricity generation and CO2 emissions in the absence of BEVs. From the top, it shows renewable energy, nuclear, natural gas, and coal-fired power, but CO2 emissions from coal account for more than half of the total emissions. considering the additional demand for BEVs recharging (right), the power supply mix will change as the amount of electricity generated increases. The concept of marginal power supply takes into account changes in the power supply mix.
The conventional BEV CO2 emissions calculation is incorrect.
Since supply and demand must always be matched along with the demand for electricity, the power system controls operations so that the amount of electricity generated matches the fluctuating demand. Here, we consider the operating costs of various power sources and the adjustment of power supply and demand. Among the regulated power sources shown in Figure 4, "Marginal power sources are those that increase or decrease total power generation in response to increases or decreases in power demand. Since CO2 emission factors differ greatly among power sources, it is very important to decide which power source to use.
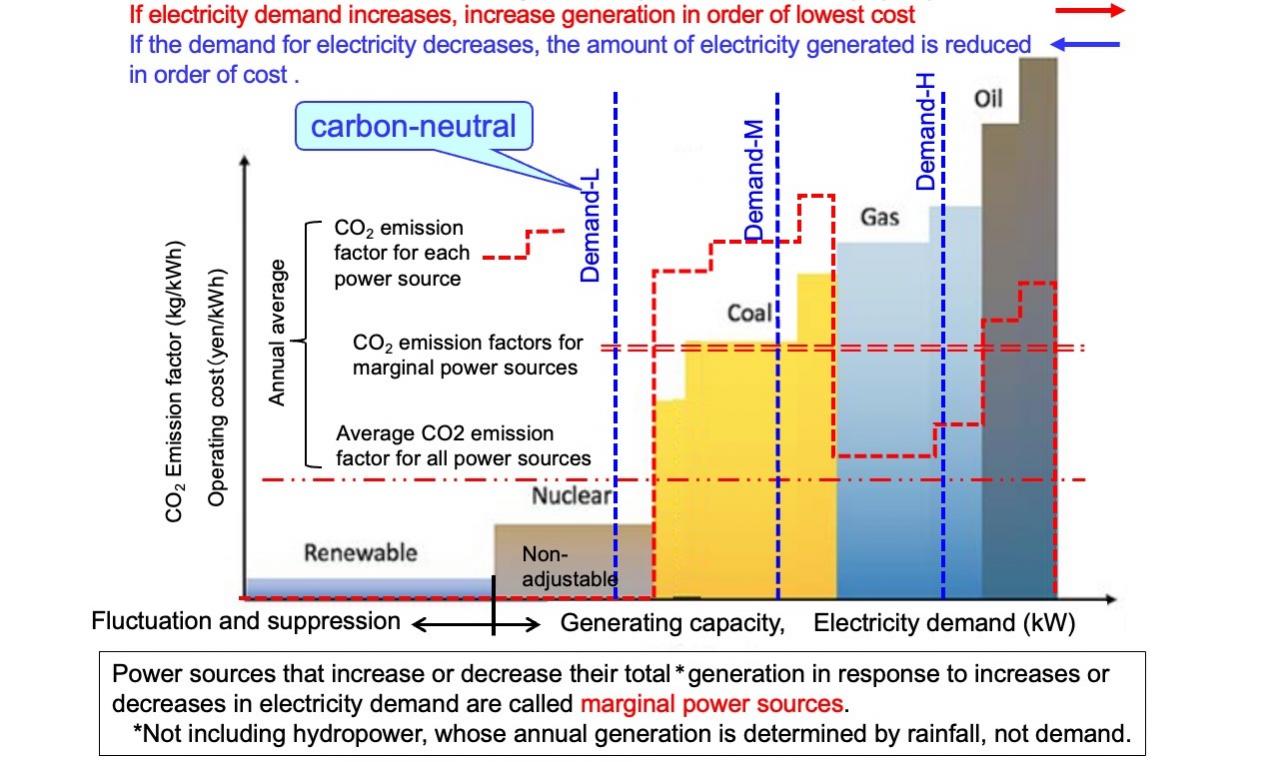
The various power sources are listed in order of operating cost, with generation capacity and power demand on the horizontal axis and operating cost on the vertical axis. Based on the economic principle, when electricity demand increases, the power generation is increased from left to right, and when it decreases, the operation is controlled in the opposite direction. As a result, when demand is M, coal becomes the regulating power source; when demand is H, natural gas becomes the regulating power source; and when demand is L, renewable energy becomes the regulating power source because nuclear power cannot be regulated. The CO2 emission factors for each source and the average annual emission factors for all sources and marginal sources are shown as dashed lines.
Olivier Corradi : Estimating the marginal carbon intensity of electricity with machine learning, Published in Electricity Map, Jul 3, 2018
Since marginal power sources vary depending on the power generation status of the power system, we consider operational control in three separate cases.
Figure 5 shows the case of power plant operation control during normal operation and renewable energy curtailment. Normally, when electricity demand increases, fossil fuel generation increases the amount of electricity generated, so CO2 emissions increase significantly, and the increase can be calculated using the emission factor of fossil fuel generation for marginal power sources.
When renewable energy generation increases, there will be cases where the amount of renewable energy and nuclear power generation exceeds demand, and renewable energy generation will be curbed. When electricity demand increases, the amount of renewable energy generation that has been suppressed increases, so CO2 emissions do not increase and carbon-neutral electricity is obtained.
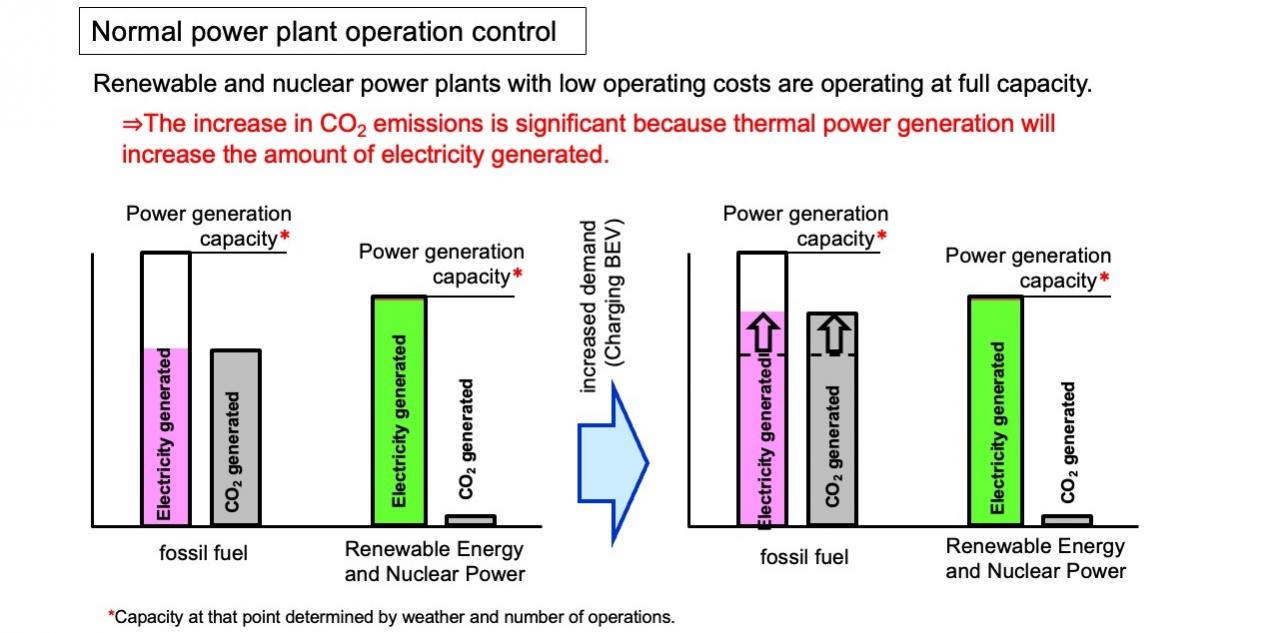
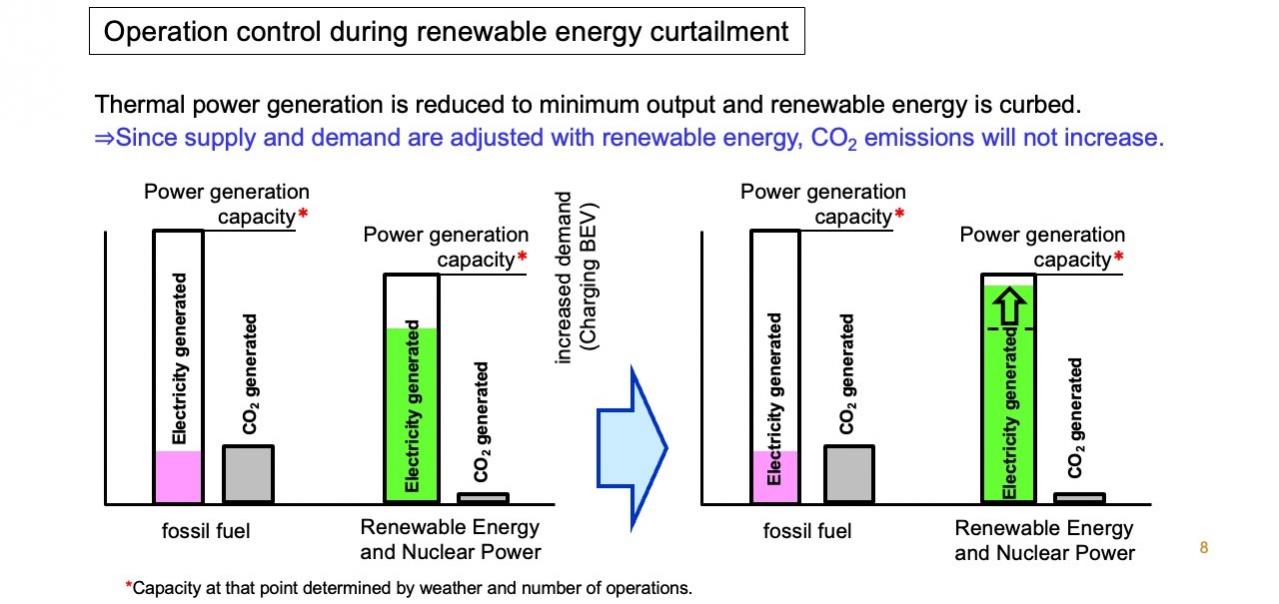
Power sources are divided into two categories: fossil fuel generation and renewable and nuclear power. The above panel shows the case without BEVs, and the below panel shows the case where charging demand is added. In the normal case (left), renewable and nuclear power with low operating costs are generating power at full capacity at the time, so fossil fuel power is adjusting supply and demand with a margin. When a surplus of electricity is generated (right), fossil fuel power generation is reduced to the last possible amount, and the surplus electricity is then used to adjust supply and demand by curtailing renewable energy generation.
In contrast, the all-source average approach assumes that when electricity demand increases, all power sources increase their generation at the same rate, so the increased demand is controlled so that not only fossil fuels but also renewable and nuclear power sources increase their generation. As a result, the increase in CO2 emissions is much smaller than in the marginal power source approach, but it differs from the actual value because it assumes a situation that cannot occur in reality, in which renewable and nuclear power sources generate more power than they can generate.
Specific figures were applied to calculate the increase in CO2 emissions when electricity demand increases. Here we assume the case where thermal power generation is the marginal power source. As shown in Figure 6, when calculating the increase in CO2 emissions when 10,000 kW of electricity is used and the power usage is increased by 100 kW and operated for one hour, the "difference in emissions" and the actual "increase" do not match. There is a mistake somewhere!" That is to say.
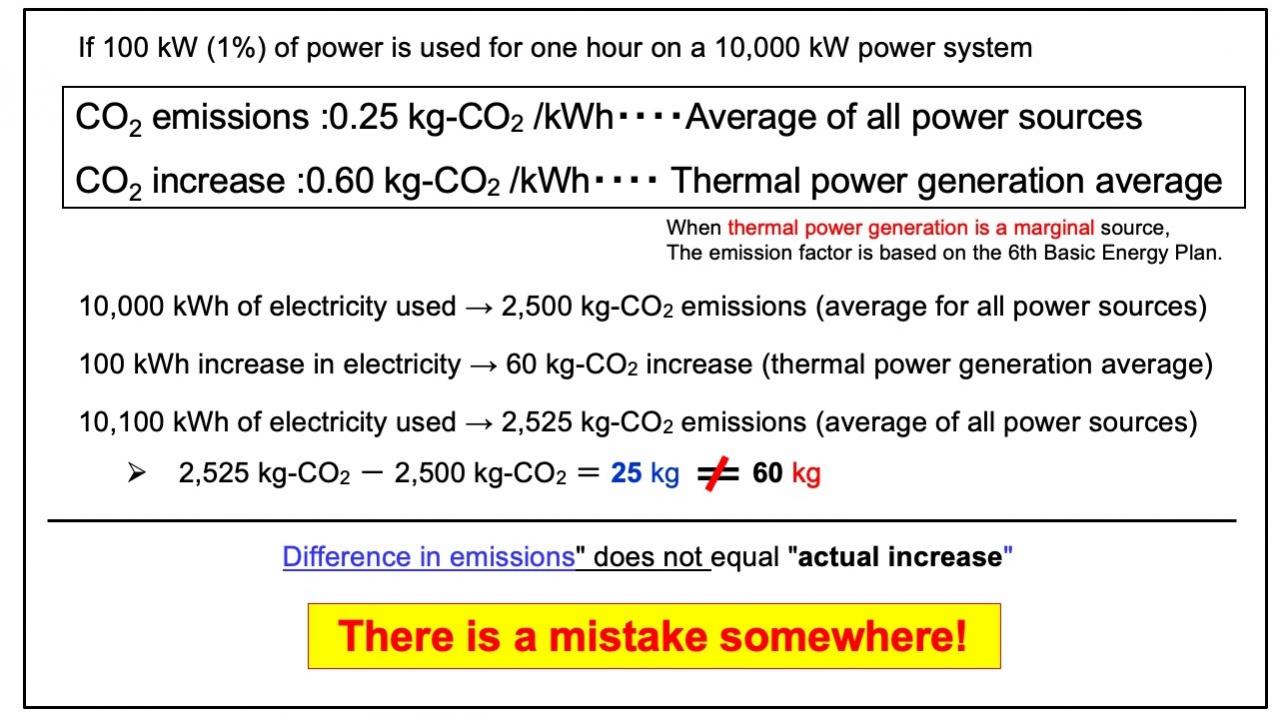
Calculating the difference in emissions between 10,000 kWh and 10,100 kWh using the average emission factor for all power sources yields 25 kg. On the other hand, since thermal power generation actually increases the amount of electricity generated, the increase is 60 kg when calculated using the emission factor for thermal power generation. The "difference in emissions" calculated using the average coefficient for all power sources and the actual "increase" do not match.
The next step is to identify the causes of the difference in the values of CO2 emissions between the average of all power sources and the marginal power sources. The relationship between electricity demand, emission factors, and emissions is shown in Figure 7. In addition to the increase in emissions due to A: electricity use, which is calculated by the factor of the average of all power sources, there is also an increase (thin skin) due to B: changes in the emission factor. In other words, the actual emissions increase can be expressed as ΔX+ΔY. As IASTEC shows in Eve's example, the calculation based on the average of all power sources, which assumes a constant emission factor and ignores ΔY, results in a large discrepancy with the actual value. In other words, it is an incorrect calculation.
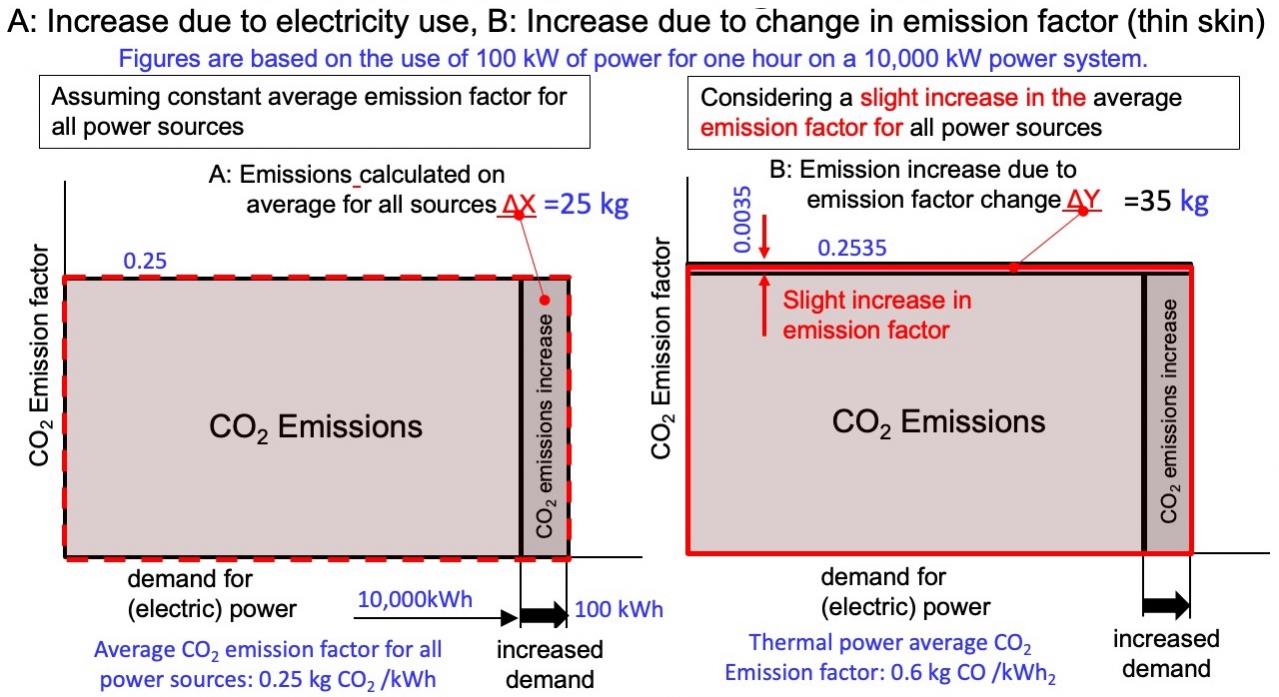
Taking electricity demand on the horizontal axis and CO2 emission factors on the vertical axis, the gray area is CO2 emissions from the power system. Using the average approach for all power sources (left), the increase in CO2 emissions ΔX due to an increase in demand of 100 kWh would be 25 kg. In reality, an increase in electricity demand causes thermal power generation to generate more electricity, so the emission factor for the average of all power sources increases slightly (right). Although the increase in the emission factor is small, multiplying this by total demand yields a significant value of ΔY of 35 kg.
This can be considered mathematically (high school math III) as shown in Figure 8.
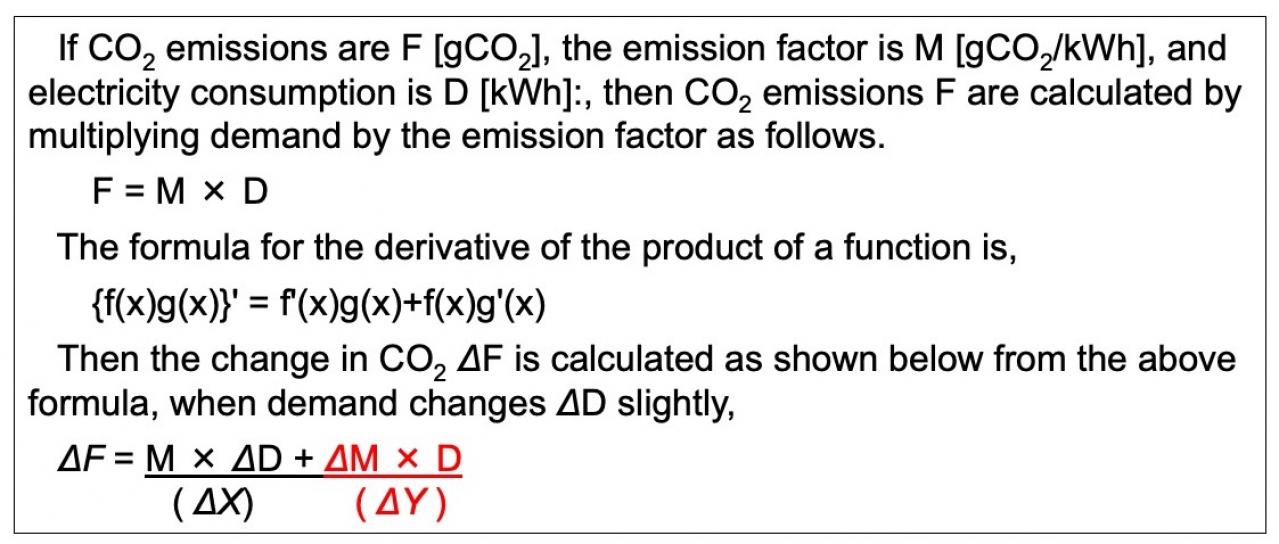
CO2 emissions are F, the emission factor is M, and the electricity use is D. The change in CO2 emissions ΔF for a ΔD change in electricity demand was calculated using the formula for the derivative of a product of functions. The first term is consistent with the formula using the average of all power sources. The second term is not zero because the change in emission factor ΔM is very small but the demand D is very large.
The first term of the emission increment ΔF corresponds to the calculated ΔX for the average of all power sources and the second term corresponds to ΔY for the thin-skinned portion. It is important to remember that in reality, the emission factor of the average of all power sources changes slightly (ΔM ≠ 0) because marginal power sources increase or decrease their power generation. The error in the calculation based on the average of all power sources lies in the fact that the second term is ignored (ΔY = 0), assuming that the emission factor M remains unchanged (ΔM = 0) even if electricity demand changes.
Definition of CO2 emissions of an electrical device and discussion of “marginal power source theory”
Applying the case of N electrical devices using grid power to the graph in Figure 4, the emissions of each device can be illustrated as ① to N in Figure 9. Here, the emissions using the average emission factor for all power sources is A=ΔX, and the emissions collected from the thin-skinned part of Fig. 7 correspond to B=ΔY. Since we do not know from which power plant each electrical device uses electricity, the total CO2 emissions are allocated to A according to the amount of electricity used. This value, ignoring the small change in emission factor (thin-skinned part) B, cannot be used to calculate the CO2 emissions of the electrical device. This value is used when the total CO2 emissions (emissions liability) of the electricity system is fairly distributed to the individual device(consumer).
If the electrical device is turned on and off (or considered) here, the power plant to be used is identified as a marginal source, as shown in Figure 9. The increase in emissions when turned on is the sum of emissions A and emissions B, shown for n = N+1. If this value is defined as the emissions of the electrical device, the emissions of the electrical device can be calculated using the emission factors of the marginal power sources.
The sum of the emissions A of all electrical devices matches the total power generation of the grid, but it must also match when emissions A + B are summed. Here, emissions B can be positive (pink) and negative (light blue), so the sum of emissions of all devices is ΣA + (ΣB+ + ΣB- ) = ΣA, which matches the total power generation of the grid. In other words, there is no contradiction if the CO2 emissions of the electrical devices are A + B.
As mentioned above, the CO2 emissions of electrical device that is not change operation in any way are not known, but when the device is turned on or off, the CO2 emissions can be calculated using the emission factor of the marginal power source. The emission factor of the marginal power source can be obtained by computer simulation. Although complex simulations are required because total electricity demand varies over time, if the annual average of emission factors for marginal power sources is calculated by simulation, it is easy to calculate CO2 emissions of electrical devices that is close to the actual CO emissions, like like the average for all power sources.
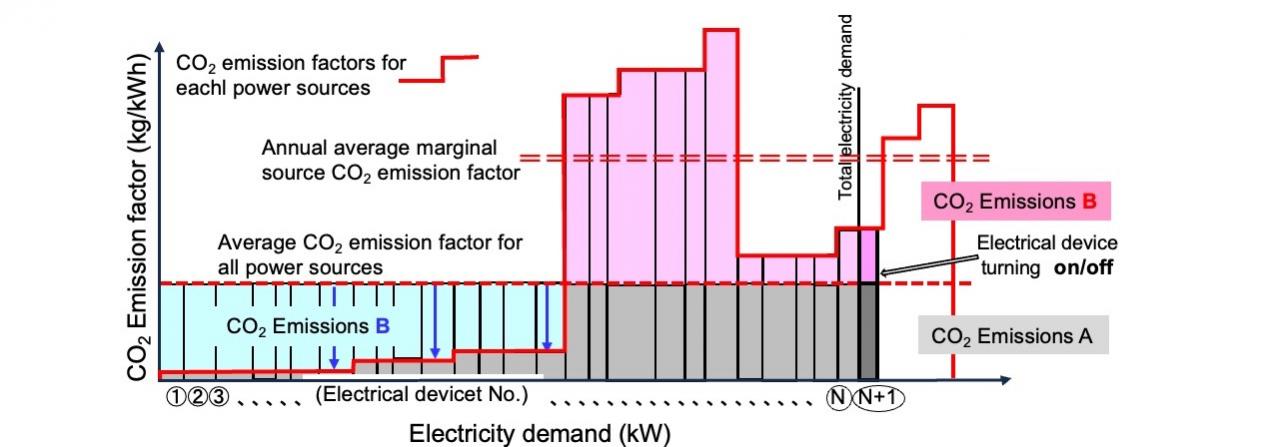
If N electrical devices are using grid power, we do not know which power plant each device is using, but hypothetically, we randomly assign the power plants used by each device to ① through N. When an electrical device is turned on or off (or considered) here, that device has selected N+1 marginal power plant when turned on and N marginal power plant when turned off, so CO2 emissions can be calculated.
We discussed CO2 emissions from BEV recharging based on the concept of marginal power sources and explained that calculations using the commonly used average emission factor for all power sources are incorrect. This will not change if renewable energy generation becomes widespread, but the situation will be different as the opportunity for renewable energy generation to become a marginal power source increases and carbon-neutral power becomes available. In the second part of this paper, we will discuss CO2 emissions in the case of mass deployment of renewable energy.


